Direct vs regular mutual fund calculator
Direct vs Regular Mutual Fund Calculator: SIP Cost Difference Over Time
See how a recurring expense-ratio (TER) gap between Direct and Regular plans compounds on a monthly SIP or lumpsum. Enter expected gross return before fees, each plan's TER, horizon and investment style. Built for Indian investors by Findost / PaisaGuru by Findost.
Toggle SIP (1) vs lumpsum (0), then adjust amounts and rates. The headline shows estimated wealth left on the table if you pay the higher Regular cost under the same gross-return assumption. Illustrative educational maths only — not investment or tax advice.
Estimated wealth gap (Direct − Regular)
₹5.1 L
Worked example: ₹10,000/month SIP, Direct 0.5% vs Regular 1.5% TER
Assumptions (illustrative — not live AMFI / AMC TER quotes): ₹10,000/month SIP, 12% expected gross return before fees, Direct TER 0.5%, Regular TER 1.5%. Net returns used in the math: Direct 11.5% and Regular 10.5% (gross − TER). Same SIP future-value formula as the widget above.
| Input | Direct | Regular |
|---|---|---|
| Monthly SIP | ₹10,000 (same for both) | |
| Gross expected return | 12% p.a. before fees (assumption) | |
| Expense ratio (TER) | 0.5% | 1.5% |
| Net return used | 11.5% | 10.5% |
Multi-horizon stats: corpus, rupee gap & % wealth left on the table
Same worked-example assumptions. "% wealth left on the table" = gap ÷ Direct corpus. Figures round to the nearest rupee.
| Years | Invested | Direct corpus | Regular corpus | ₹ gap | % left on table |
|---|---|---|---|---|---|
| 5 | ₹6,00,000 | ₹8,13,572 | ₹7,91,555 | ₹22,016 | 2.7% |
| 10 | ₹12,00,000 | ₹22,55,442 | ₹21,26,594 | ₹1,28,847 | 5.7% |
| 15 | ₹18,00,000 | ₹48,10,828 | ₹43,78,276 | ₹4,32,552 | 9.0% |
| 20 | ₹24,00,000 | ₹93,39,666 | ₹81,75,968 | ₹11,63,698 | 12.5% |
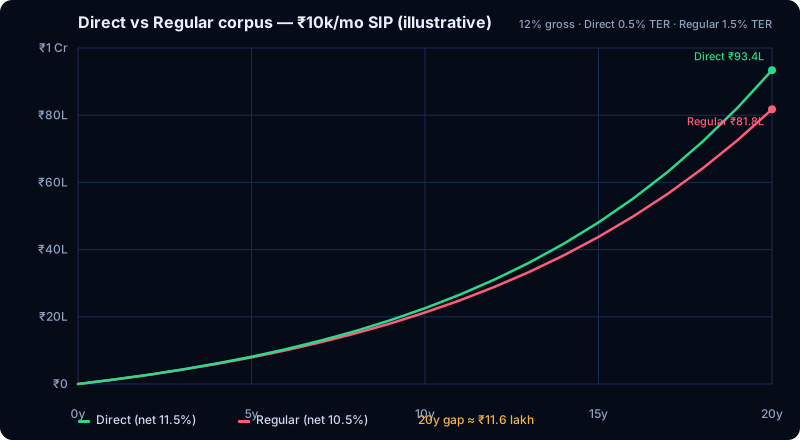
At 20 years the illustrative gap is about ₹11.6 lakh — roughly one-eighth of the Direct corpus — from a steady 1 percentage-point TER difference on a ₹10,000 SIP.
Chart: Direct vs Regular corpus over 20 years
How the expense-ratio gap compounds
The calculator (and the tables above) use a simple net-return identity:
net return ≈ gross expected return − plan TER
For a SIP, each month's contribution then compounds at that net monthly rate. A seemingly small TER gap (here 1.0 percentage point: 1.5% − 0.5%) is paid every year the money stays invested, so the rupee gap grows faster than linearly — from about ₹22k at 5 years to about ₹11.6 lakh at 20 years in the worked example. Changing the widget's TER sliders or horizon updates the same math for your own inputs.
How large is the gap in real schemes? Our regular vs direct TER gap 2026 study of AMFI TER data (30 Sep 2026) found a median Regular-minus-Direct gap of 0.785 percentage points across India's 50 largest active equity funds. Many investors hold several schemes — AMFI data show roughly 4.5 folios per unique investor (see how many mutual funds Indians hold) — so check the plan type of each one.
Direct vs Regular — what actually differs
- Commission / trail: Regular plans typically embed distributor compensation in the expense structure; Direct plans usually do not, which is why Direct TERs are often lower for the same scheme.
- Same underlying portfolio: For a given scheme, Direct and Regular generally share the same fund manager decisions and holdings book — you are not buying a different equity strategy by choosing Direct.
- When Regular might still be chosen: Some investors prefer distributor-led research, paperwork help, or behavioural coaching and are willing to pay via the Regular TER. Cost alone does not decide suitability.
- When Direct is often preferred: DIY or fee-only-advised investors who can monitor schemes themselves may keep more of the gross return by using Direct — still subject to market risk and scheme selection.
Educational framing only. Findost / PaisaGuru by Findost are not SEBI-registered investment advisers via this page, and are not affiliated with Findoc or FinDost. Confirm live TERs on AMC factsheets before acting.
Frequently asked questions
What is the difference between Direct and Regular mutual fund plans?
For the same scheme, Direct and Regular typically share the same portfolio and fund manager. Direct usually carries a lower expense ratio because distribution / trail commission is not built into that plan. Service model and who helps you stay disciplined can still differ.
In the ₹10,000/month SIP example, how large is the Direct vs Regular gap at 20 years?
Under the illustrative assumptions (12% gross return, Direct TER 0.5%, Regular TER 1.5%), the Direct corpus is about ₹93.4 lakh and the Regular corpus about ₹81.8 lakh — a wealth gap of roughly ₹11.6 lakh, or about 12.5% of the Direct corpus left on the table. These are educational maths, not live fund quotes.
What is the Direct vs Regular gap at 10 and 15 years in the worked example?
Same assumptions: at 10 years the gap is about ₹1.29 lakh (≈5.7% of Direct corpus); at 15 years about ₹4.33 lakh (≈9.0%). The rupee gap widens nonlinearly because the expense-ratio drag compounds every month.
How does this calculator model expense-ratio drag?
Net return ≈ gross expected return − plan TER. The tool compounds a SIP or lumpsum at each plan’s net rate. Real returns, TER changes, exit loads and taxes are not modelled. Treat the gap as an illustrative cost-of-drag estimate.
Is Direct always better than Regular?
Cost is one input, not a slogan. Direct can leave more of the return with you if you (or an advisor you pay separately) can research and monitor well. Regular may include distributor-led assistance that some investors value. Suitability still depends on the scheme, goals and behaviour — not only TER.
Is this investment advice from Findost / PaisaGuru by Findost?
No. Educational mathematics for Indian investors only. Findost (findost.io) and PaisaGuru by Findost are not affiliated with Findoc or FinDost. Confirm plan expense ratios on AMC or registrar disclosures before acting. Not tax or investment advice.
Explore more: all calculators, the direct vs regular guide, our TER gap study of the 50 largest equity funds (AMFI data), the fund overlap calculator, the SIP calculator, how many mutual funds should I have, and Direct vs Regular blog.
Where to go next
Switching from regular to direct is a redemption, so units under 12 months attract 20% STCG. Run the numbers in theequity capital gains calculator before you switch. And if you're starting fresh, a direct-plan step-up SIP compounds the cost saving every year.